An Eggsperiment with Data Collection
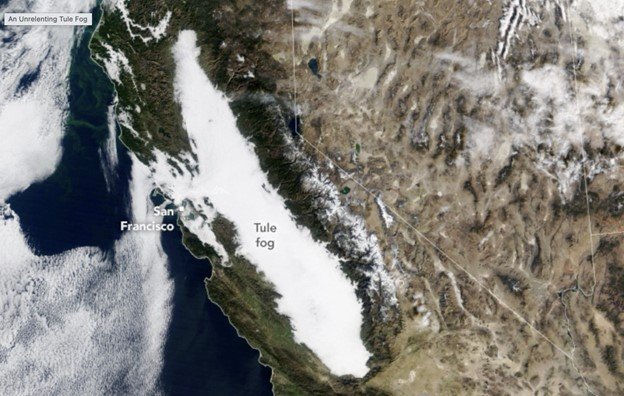
NASA Satellite Image from 9 Dec 2025 (https://science.nasa.gov/earth/earth-observatory/an-unrelenting-tule-fog/)
By Dr. Toby Ault, Associate Professor in Department of Earth and Atmospheric Sciences at Cornell University and PRI Research Associate
December 16, 2025
I just wrapped up an inspiring week in California and Oregon of project meetings, site visits, alumni events, and engagements with industries that depend on climate and atmospheric research and data. During this trip, I met with renewable energy producers, water resource managers, forecasters for California's energy grid, insurance and reinsurance companies, engineering firms, energy storage innovators, and architects designing large-scale infrastructure for the climates of the 21st century. While my impressions of it are still fresh, I wanted to share some (unfiltered) thoughts about this experience, along with my immeasurable gratitude to the hosts, colleagues, friends, coworkers, students, postdocs, collaborators, and foundations who made this trip possible.
Background & Motivation
Funded by the fumes of philanthropic gifts my lab had received in recent years, I headed to fulfill the commitments I had made. I had planned this trip for months in advance to try and accomplish three things in just over four days: (1) meet with as many collaborators and potential industry partners as possible; (2) give evening talks to Cornell alumni about the state of research, teaching, and funding in the Dept. of Earth and Atmospheric Science (EAS); and (3) drive an air quality sensor equipped with GPS from San Diego (CA) to Lake Oswego (OR).
To call the budget for this trip a shoestring would be an insult to shoestrings. Then again, one of the hypotheses I have been working under is that, given the new funding realities we face, we are going to have to figure out a way to do more with less.
I wrote the remainder of this post using the headers of a typical research paper, but it is meant to be accessible to 8th graders and grandparents alike. Do not be intimidated.
Materials & Methods
The sensor I took with me is a touchscreen aerosol and gas detector called an Air Quality Egg. Although this device measures particulate matter distributions between one and ten microns, here I will focus only on fine particulate matter smaller than 2.5 microns (PM2.5), along with temperature, humidity, pressure, and CO2. Victor Aprea additionally equipped this prototype with an integrated GPS so that each measurement could be geolocated in space and time during mobile deployment.
I affixed the Air Quality Egg to the roof of a four-door Honda Civic using a collapsible laundry basket from Albertsons and ratcheting straps I purchased from Home Depot (see photo below). I also used bubble wrap to protect the roof of the car and to shield the device from the temperature of the car.
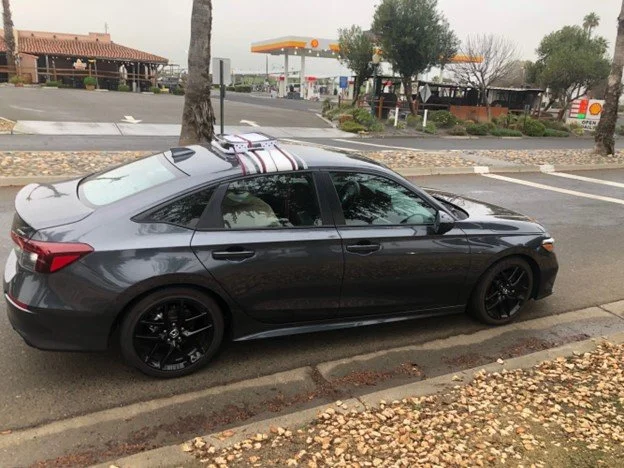
Air quality egg strapped to roof of Honda Civic for sampling.
Given the severe time constraints I had for making all of these preparations, I was unable to fully test the GPS and Wi-Fi connection to my cell phone hotspot before heading north on Highway 15 from San Diego at about 10:30 p.m. on Tuesday the 8th. That being said, I have worked with Victor long enough to know that he is a careful, reliable, and detail-oriented partner. I knew he had probably tested everything more than once and I felt confident it would probably work as long as I could ensure the egg was connected to a reliable power supply. Rather than plugging it into the car’s USB port, I instead employed an Anker 20000mAh lithium-ion USB battery so that I could at least see if the LED display was on and (ideally) would mean electricity.
While some of you might hope to see data from the I-5 corridor from San Diego through Los Angeles, that experiment will have to wait until some future date. Leaving after 10:00 PM on Tuesday, Dec 9th, I decided to take the much faster eastern route (Highway 15) to complete the first leg (San Diego to Bakersfield) as quickly as possible. The second leg took me from Bakersfield to Palo Alto, and the third started in San Mateo after an alumni event and carried me all the way to Lake Oswego, Oregon.
In addition to the data products collected during this experiment, I also used NOAA satellite imagery to show the tule fog in the Central Valley. All video footage and other digital imagery originate from my iPhone 8+. Finally, I developed a new Spotify playlist for the 1,088 mile drive that included thematically appropriate songs from the Red Hot Chili Peppers, Neil Young, Creedence Clearwater Revival, Nirvana, Smashing Pumpkins, Johnny Cash, Willie Nelson, Grateful Dead, and Leonard Cohen.
Results
Segment 1: San Diego to Bakersfield
I completed the drive between San Diego and Bakersfield in about four hours. Road conditions on Highway 15 were excellent, with virtually no traffic. Particulate matter (PM) concentrations remained low until somewhere just south of West Covina, where the lights of Los Angeles first became visible through the haze. Traffic slowed as I entered the northeastern edge of the massive highway system tangled around the greater Los Angeles area, then picked up again as I merged onto the I-5 corridor heading north.
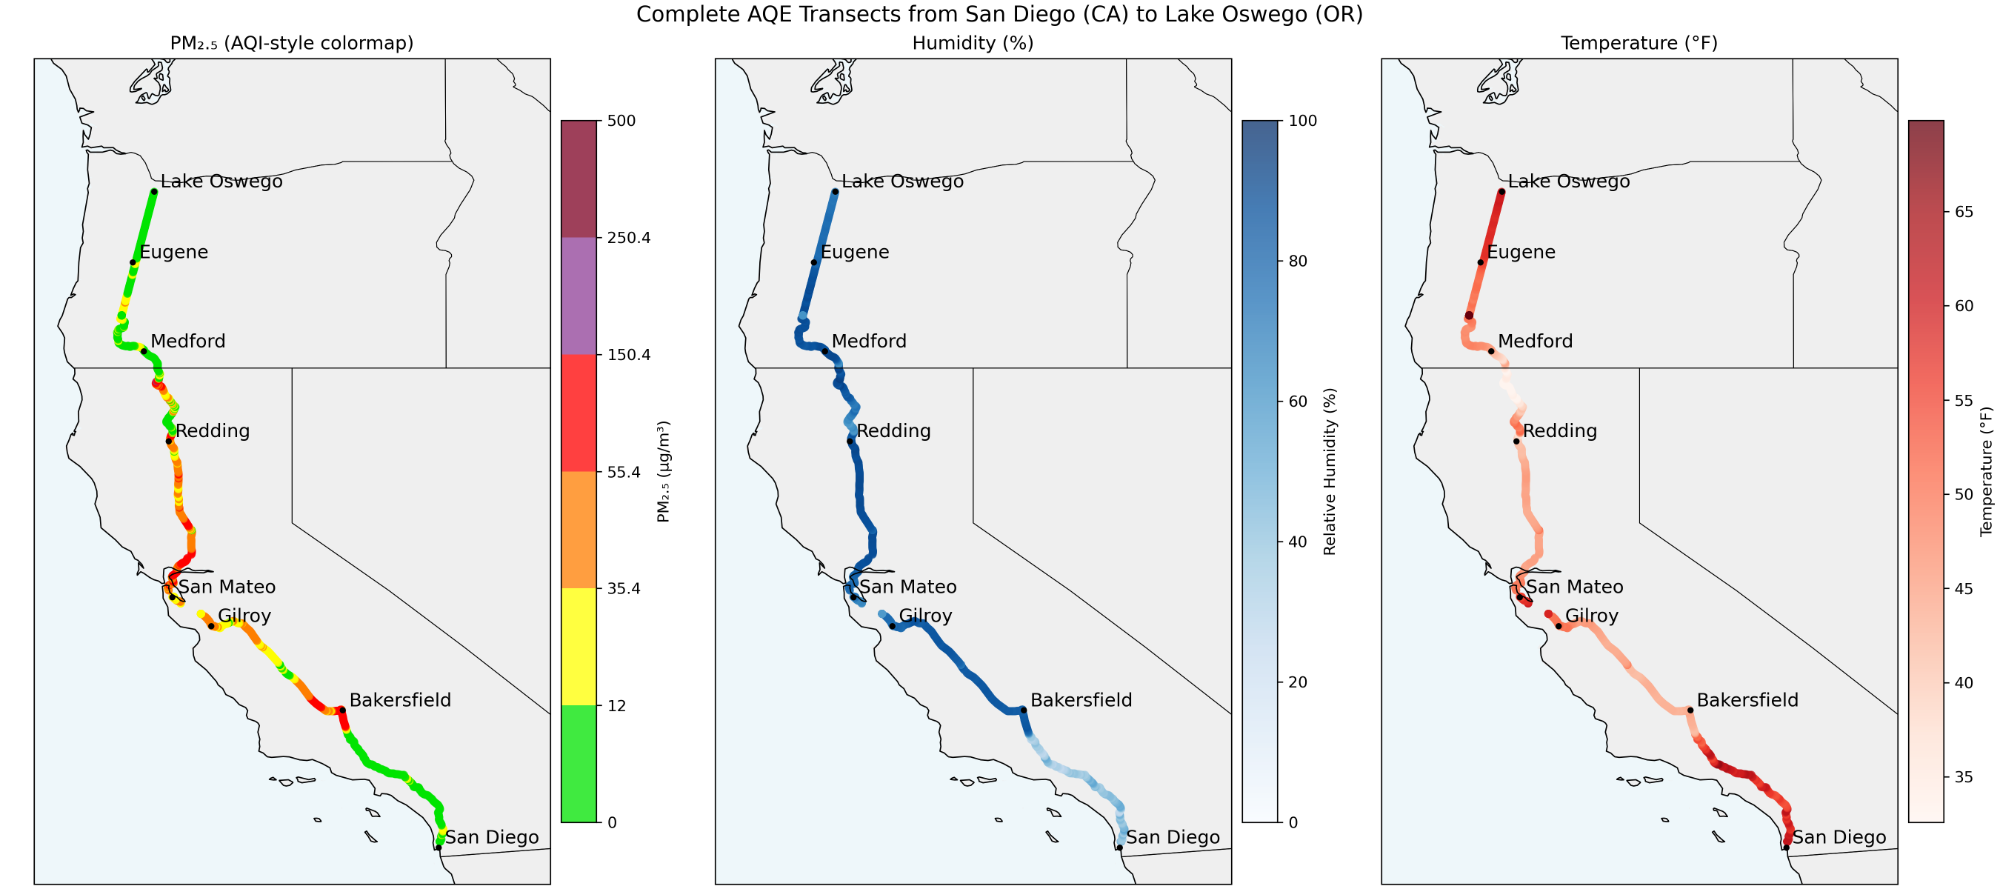
Somewhere in the stretch between Tejon Ranch and the gradual descent into the Central Valley, the fog began. You can clearly see this in Figure 1 (below) where the humidity increases and the temperature decreases due to an inversion in the Central Valley. PM2.5 concentrations also increase as the car descends into the valley.
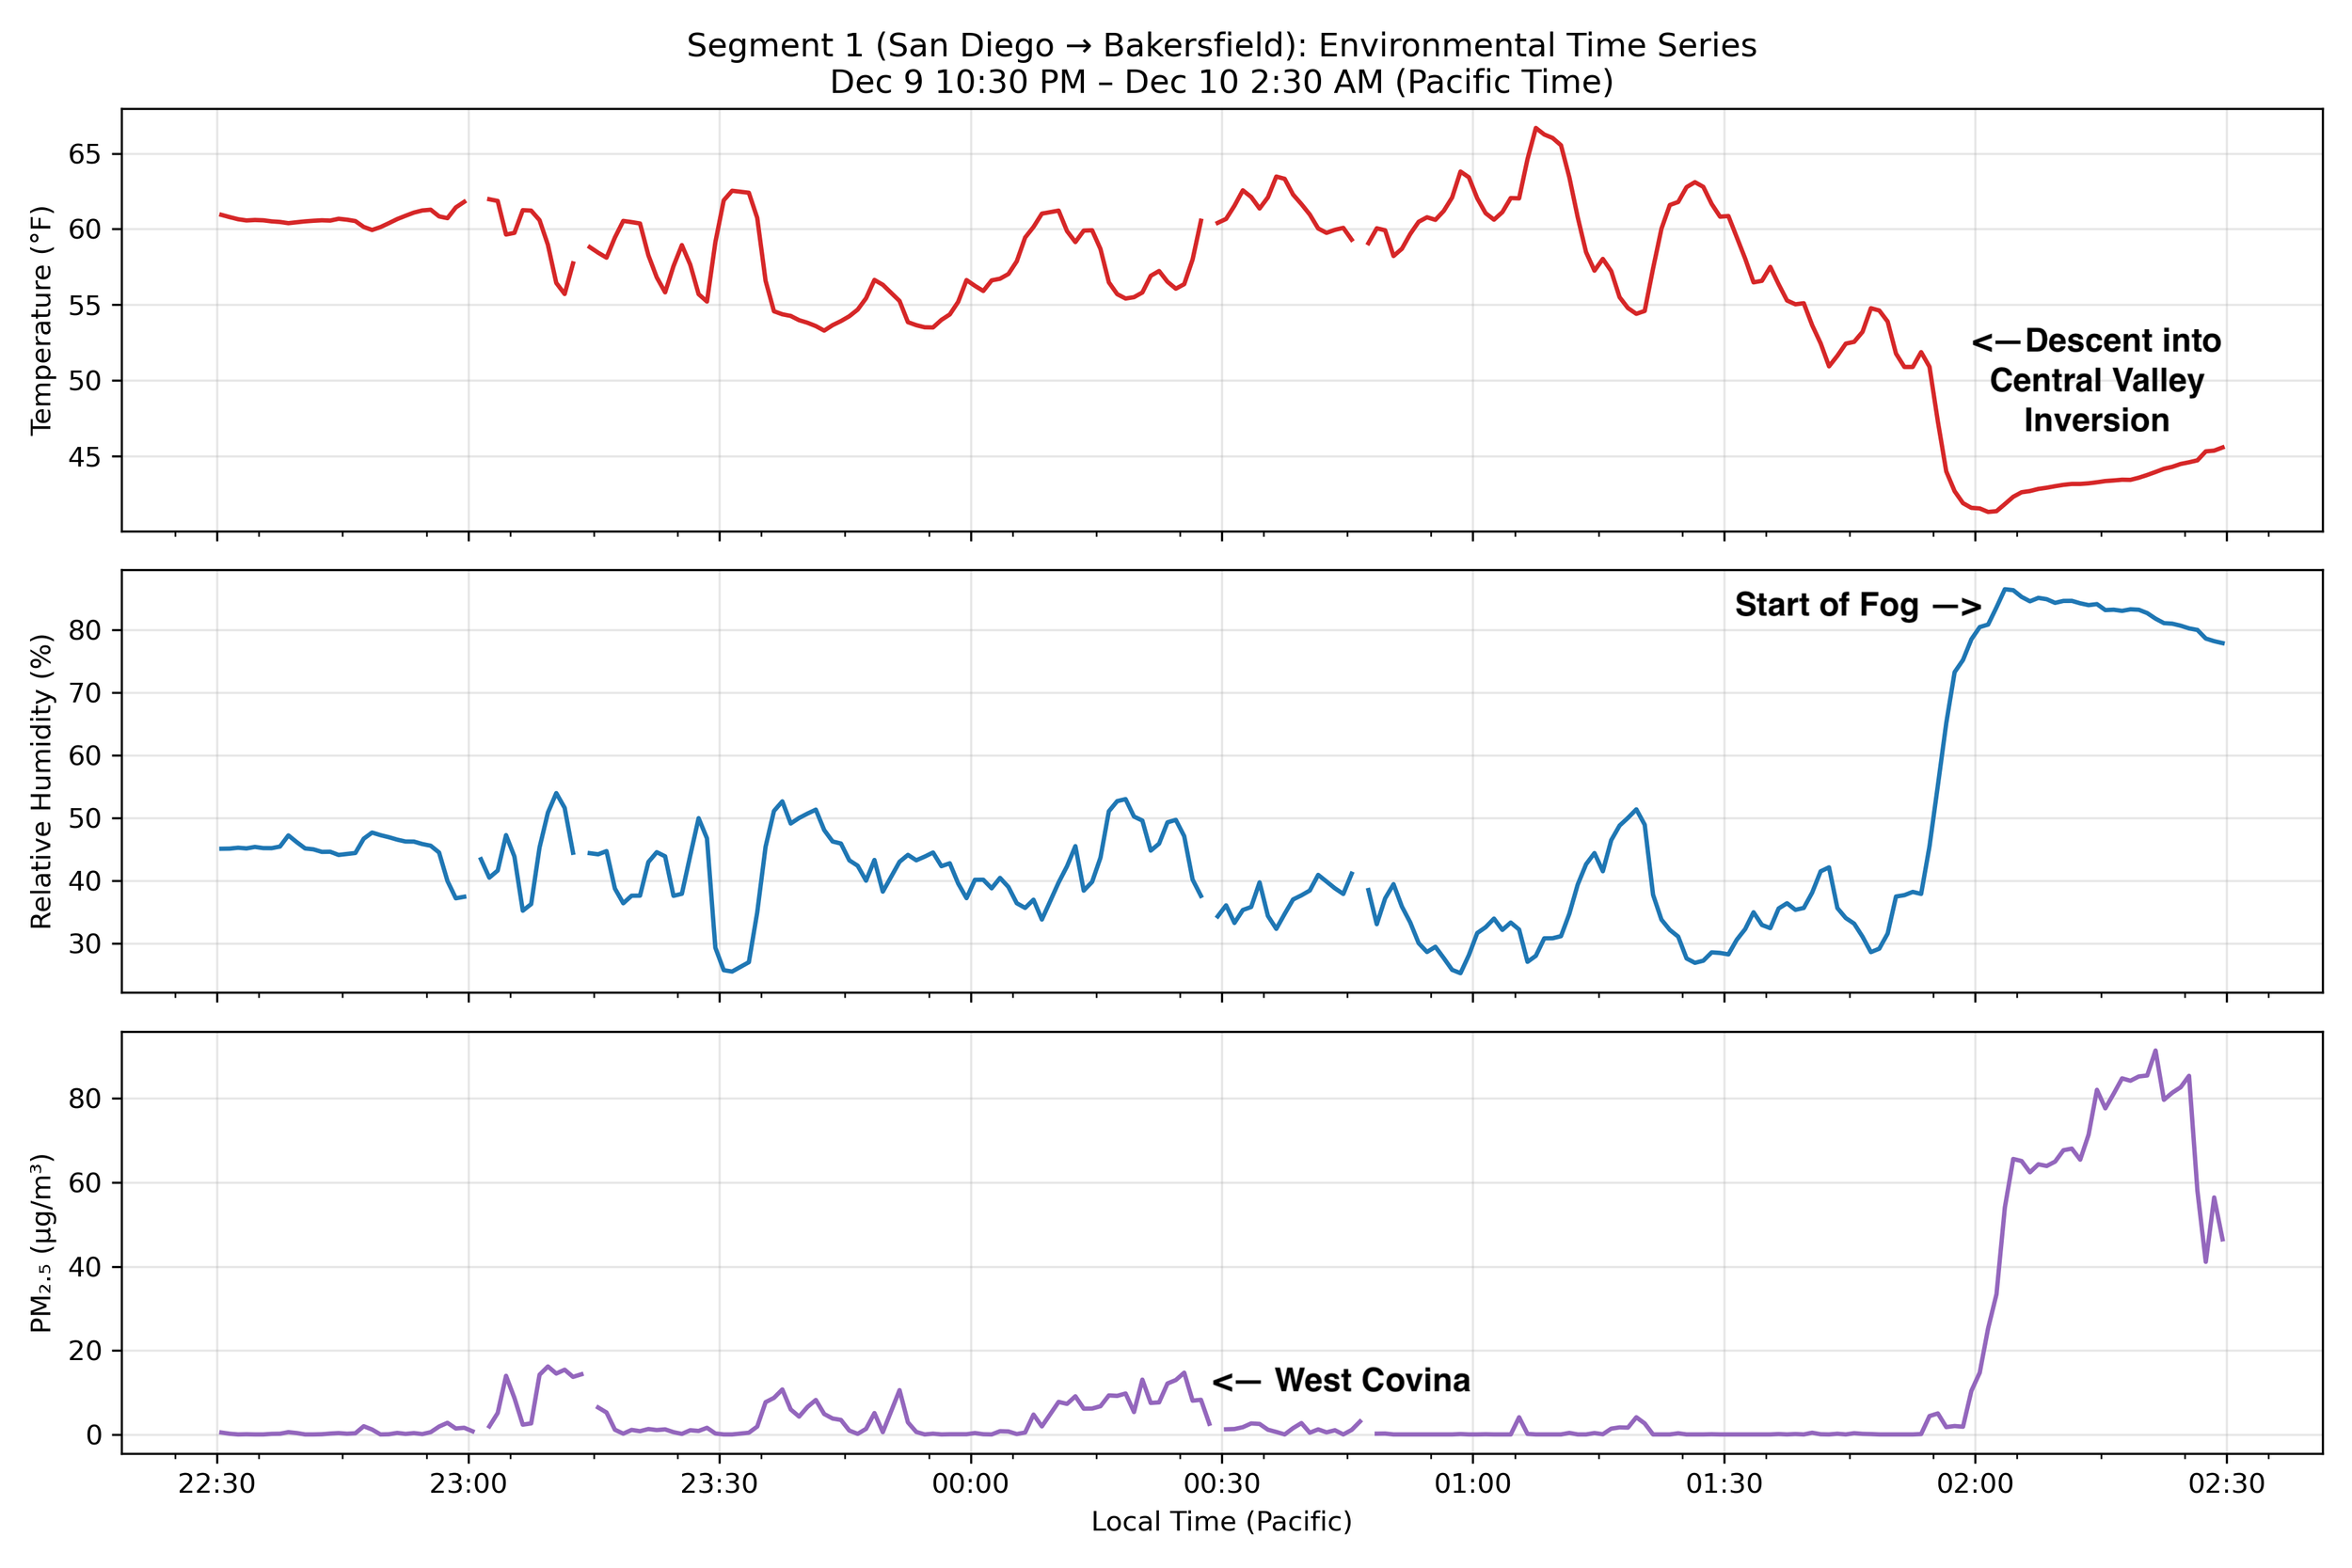
Figure 1. Time series of environmental variables for Segment 1 of the transect, spanning San Diego to Bakersfield. The top panel shows temperature, the middle panel shows relative humidity, and the bottom panel shows PM2.5 concentration. All variables are plotted as a function of time to illustrate co-evolving meteorological conditions and aerosol loading during the first leg of the journey.
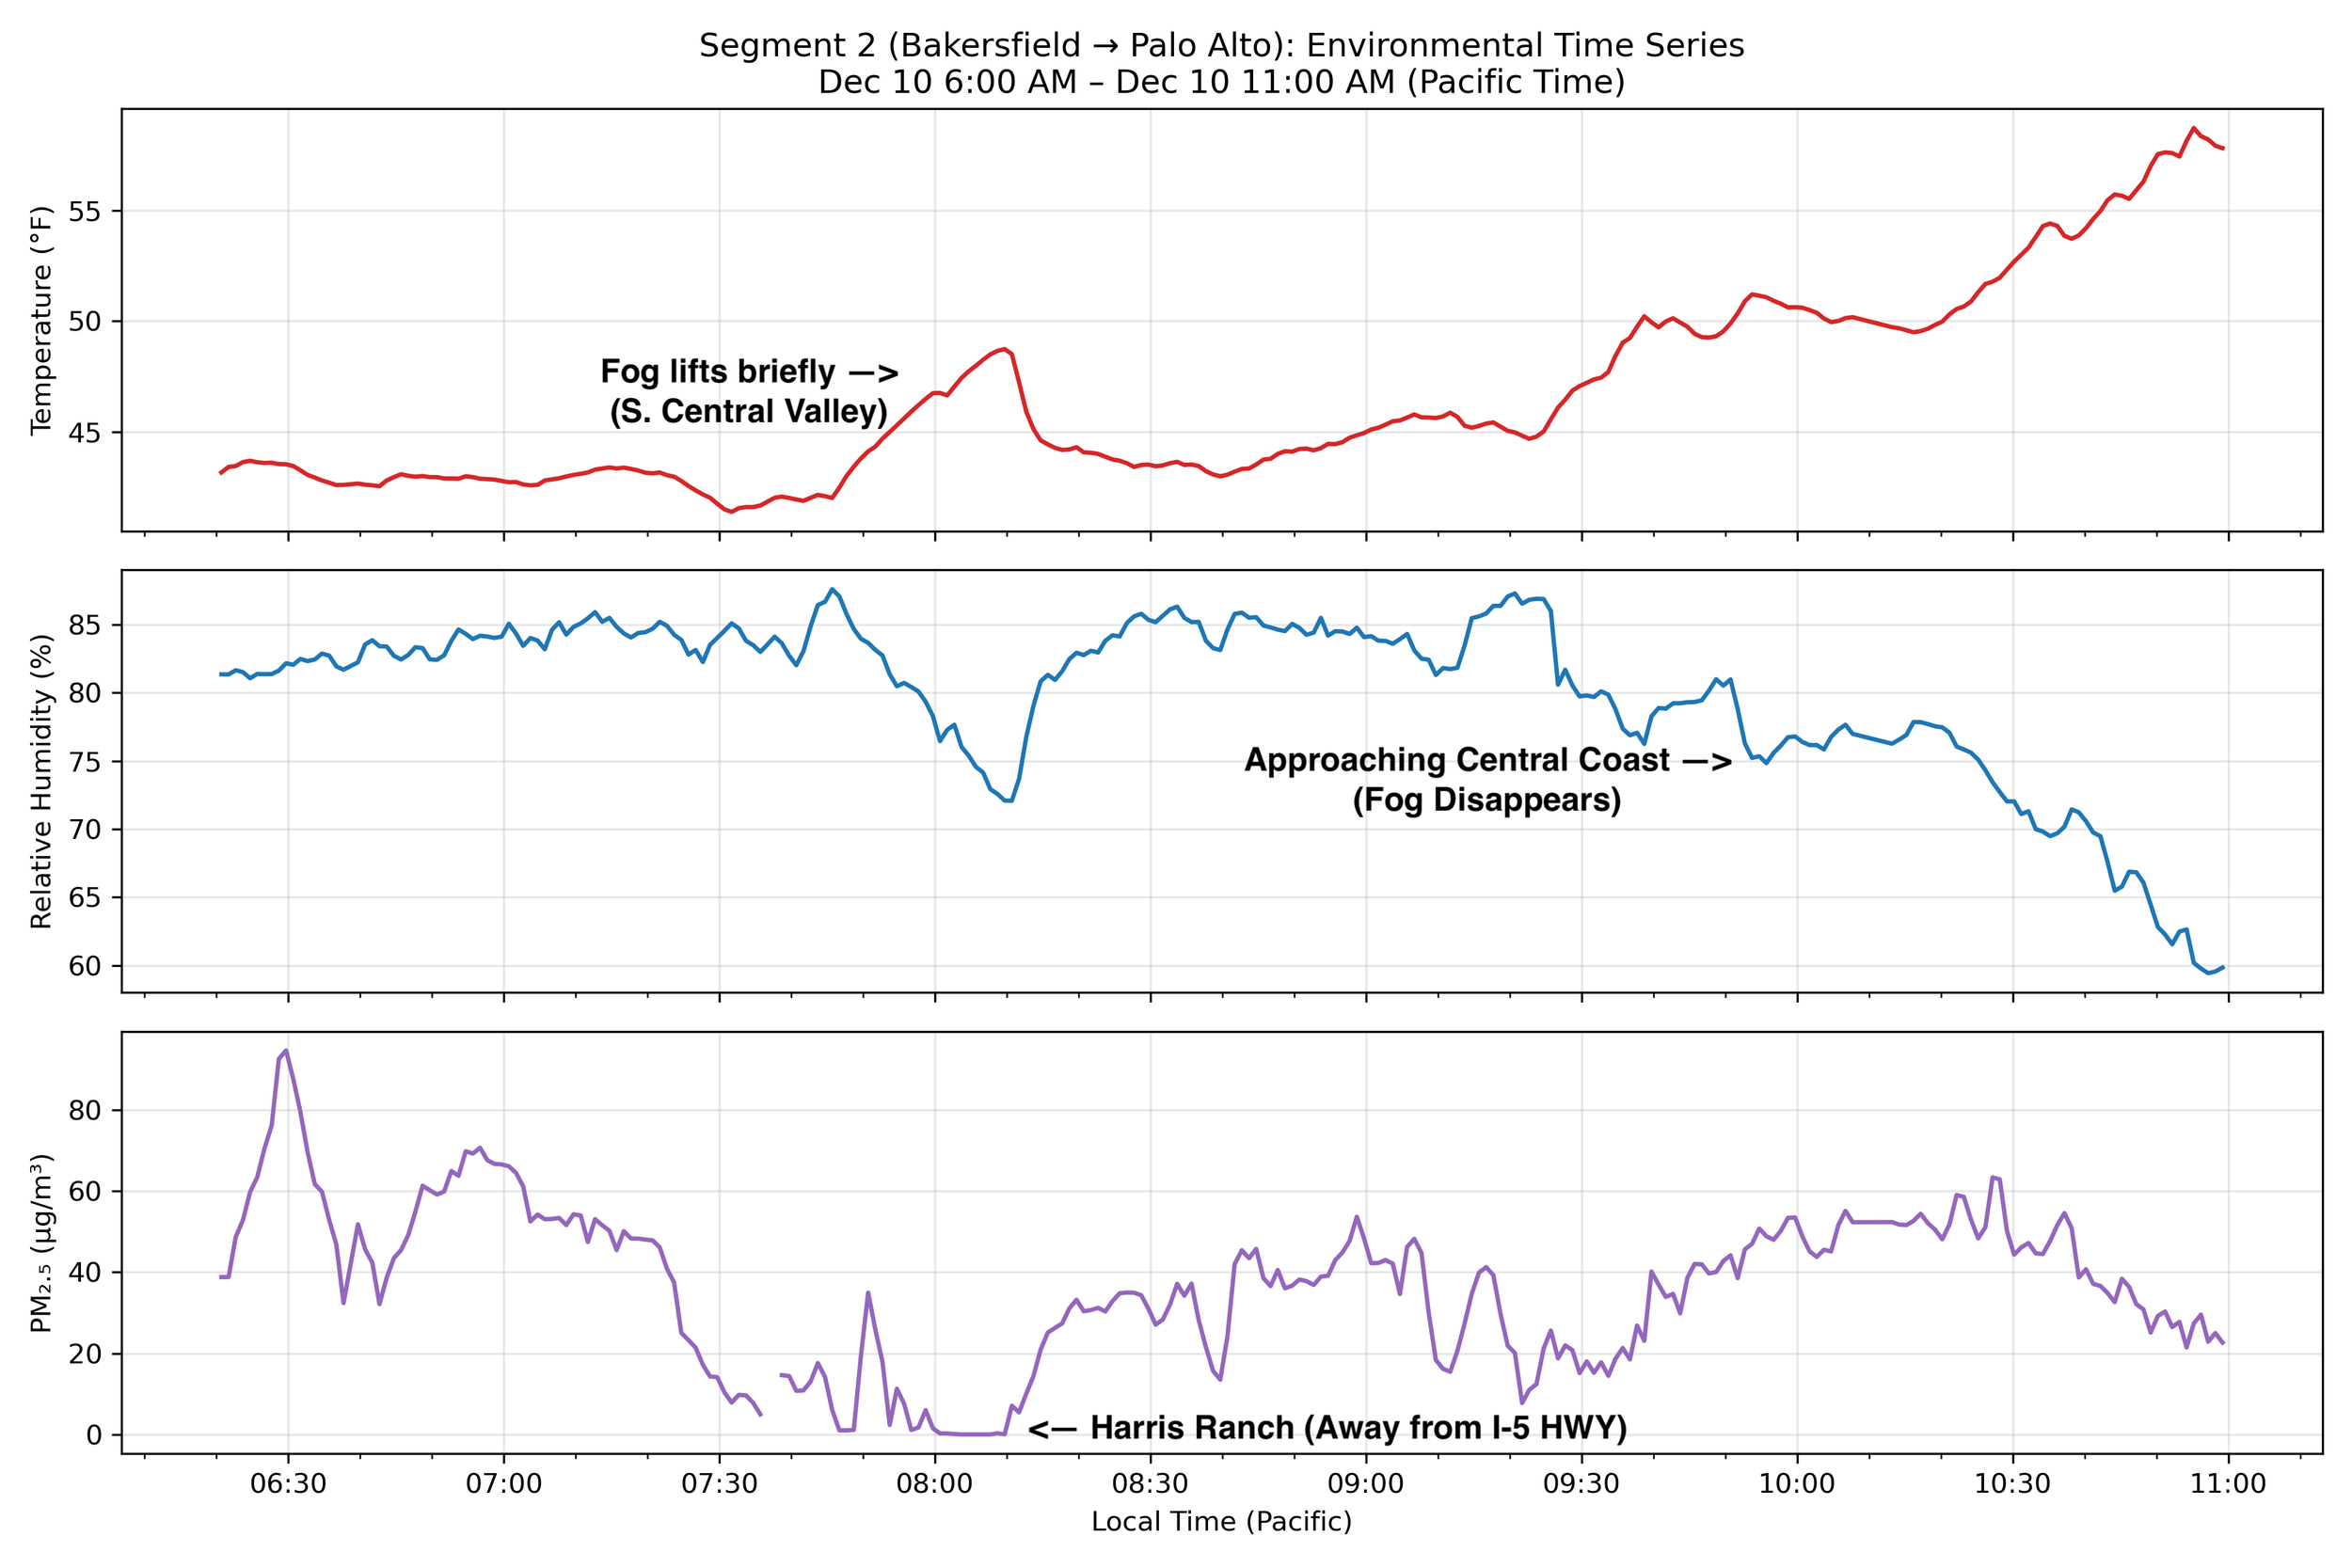
Figure 2. Same as figure one (Temperature, Humidity, PM), but for the second segment (Bakersfield to Palo Alto).
Fog dominated the experience of the second segment as well, from Bakersfield to Palo Alto, especially in the early morning hours. However, as I reached the I-5 corridor, the layer of condensation lifted slightly, forming more of a low stratus cloud deck. Beneath it, I could see the bright green, optimistic grasses and rolling hills of the southern Central Valley, the California aqueduct system, and the vast network of electric transmission lines crisscrossing the highway.
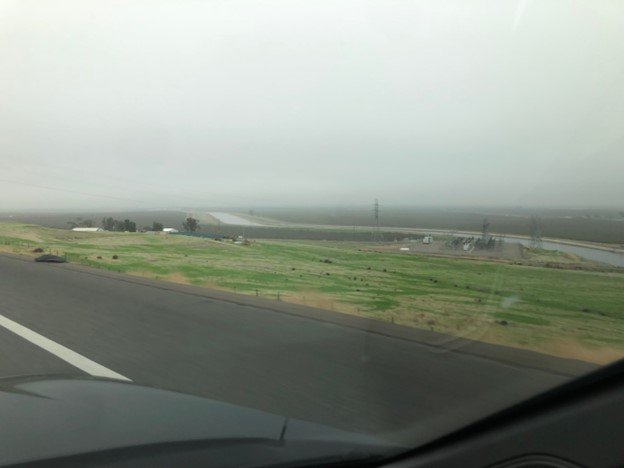
View of the California irrigation, power, and transportation systems.
As I reached the western edge of the coastal range along the central California coast, I noticed oak trees anchored to the hillside and a bright blue ribbon of sky on the horizon. The fog finally broke near the intersection with Highway 101, somewhere around Gilroy. The air smelled strongly of garlic, the crop for which this region is famous, and I was reminded that I still had not had time to check whether the sensor was actually logging all the data I hoped it would be recording.

Figure 3. Same as Figures 2 and 3, but for the final segment.
The third and final segment proved to be the most difficult. My original plan to stay the night in Redding was thwarted when I crossed back into the Central Valley and encountered, once again, a fog that would not relent. In the darkness, it slowed driving speeds well below the typical seventy to eighty miles per hour that one might otherwise expect on these wide, flat, and nearly empty nighttime highways.
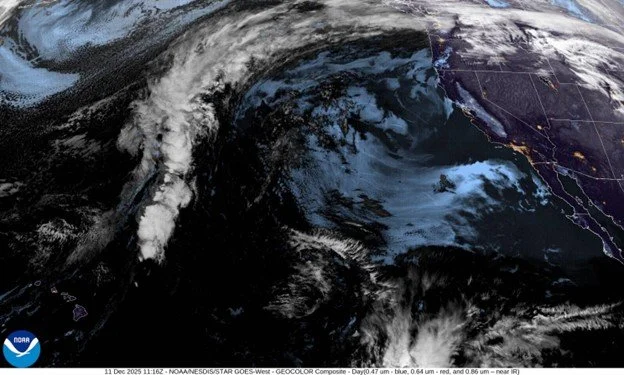
Satellite image of clouds (white) and fog/low marine clouds (light blue).
Cars would occasionally try to accelerate past me, but their automatic high beams would switch on and instantly blind them with the reflection of fog droplets straight back into their faces, forcing them to slow down. I reached Redding so late that I became concerned about the total amount of driving time remaining and about being in position for the meetings and events the following day, and I resolved to push on to Medford before resting.
The drive became increasingly tedious, even as I left the Central Valley and climbed towards the foot of Mt. Shasta. The fog would seem to break, only to return with every descent into a new valley, each one bringing a fresh new maddening obstacle. PM concentrations remained low overall, except in the valleys, where I suspect temperature inversions were trapping either smoke from wood-fired stoves or pollution from trucks laboring up the steep, winding slopes near Mount Shasta. As it turned out, I was driving through one of the most persistent and relentless fogs that this region has seen in recent memory.
I talked briefly with Robert Ross early Thursday morning about some potential research activities that might help keep the Museum of the Earth open while they work to raise the remaining funds they need given their financial difficulties. It was still pitch black outside, and I thought about the sensor on the roof, the science we were trying to do, the importance of STEM identity activation, and the pipeline that recruits students and gets young people excited about science, whether or not they ever want to become professional scientists, but as a greater good.
By sunrise, I reached the Willamette Valley and Lake Oswego before 9:30 am, where I enjoyed a nice long nap before spending a little time with my family and preparing for the evening events.
Discussion & Conclusion
The high temporal resolution sampling worked better than expected, as did the USB battery. With a single charge, I was able to run the device continuously for about 6-7 hours. The additional components (collapsible laundry basket, ratcheting straps, bubble wrap) all held remarkably well even in stress tests during the brief period of time when the fog lifted in the central valley and I maintained driving speeds in excess of 80 MPH (for science). I am returning to Ithaca feeling quite optimistic that we are now ready to start a more ambitious phase of research and outreach using these portable sensors and minimal additional equipment.
In addition to the success of the data collection experiment itself, I made nine primary collaborative stops, participated in seven events, presented to over 100 Cornell alumni, met with three potential industry partners, made two site visits to companies specializing high-resolution extreme weather forecasts, and even spent time with my own family in Oregon at the end.
Through this experience, I learned an enormous amount about impactful work being done through public–private partnerships across the West Coast. I heard stories about how renewables and energy storage systems intersect with extreme weather and climate risks in ways that hold valuable lessons for the rest of the country.
For example, if you graduated from Cornell in the mid 1990s with an interest in renewables, climate change, and weather forecasting for wind or solar, California was one of your best bets for finding a job and sustaining a fulfilling career during the ensuing decades. In this region, practitioners have been operating wind, solar, and hydro facilities against a volatile backdrop of climate extremes like the Santa Ana winds, wildfires, droughts, heat waves, and extreme rainfall. In Oregon, low flows on the Columbia River threaten hydropower, and the problem may grow worse as less precipitation falls as snowpack.
Western regions hold valuable lessons for how the tripod of academia, industry, and government can function most effectively in the face of a changing climate and shifting funding landscape for scientific research.
These lessons apply both to the observational and modeling efforts that are needed, as well as to the financial instruments, including insurance and reinsurance, that will necessarily underpin any investments in new infrastructure.
I am also extremely grateful for the feedback, conversations, data, figures, and stories provided by my fabulous EAS colleagues, many of whom are early in their careers, preparing for the American Geophysical Union (AGU) conference, and did not need to spend time helping me prepare for this trip (e.g., Flavio Lehner, Angeline Pendergrass, Esteban Gazel, Britney Schmidt, Helena Tsigos, Kyle Barnhart, Chelsea Guster, Empar Sicroff, and many others!) The work EAS is doing is extraordinary and the early career researchers are vital to the ecosystem of science and to our understanding of climate risks and the subsurface processes and materials required to make a transition away from fossil fuels.
I keep reflecting on Benjamin Z. Houlton’s statement addressing the early career faculty earlier this year: “Do your best work. Grow your network. Prove why what we do matters.” If nothing else, this trip has forced me to recognize that doing our best possible work will require us to learn from and work closely with industry. It will require the practical, fast-paced project mindset of industry, the enthusiasm and energy of our students and extraordinary faculty, and the generous support we have received from philanthropic funds such as the Einhorn Center for Community Engagement and the Atkinson Center for Sustainability.